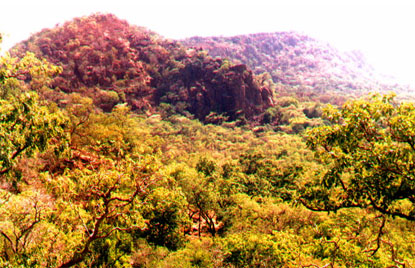
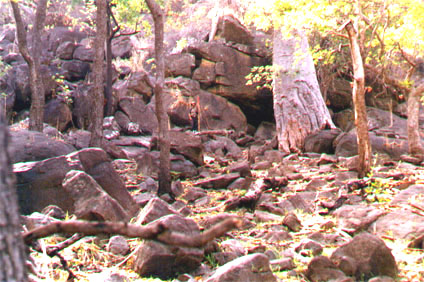
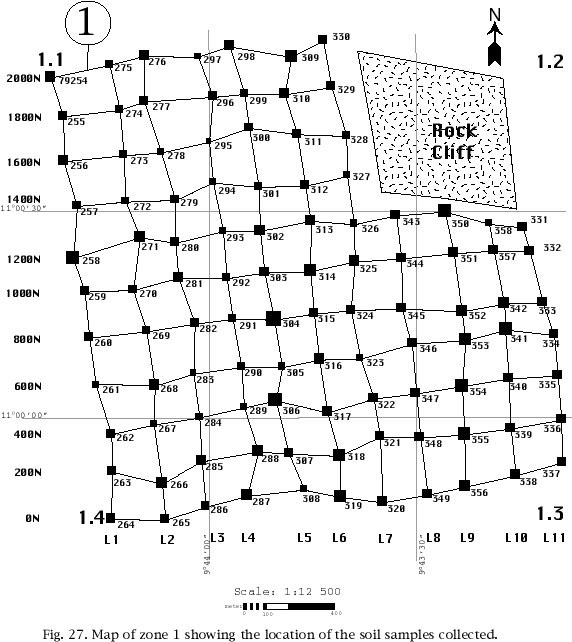
In zone number 1 (Kounkono area), 105 soil samples were collected rather than the 121 planned, because of the presence of a steep rock cliff in the northeastern corner of the zone (figure 15 and figure 16). The location of these samples is shown on figure 27. On this figure, the size of the square representing the sample location is proportional to the accuracy of the location as given by the GPS (that is: a larger square means that the possible location error, in meters, is larger than for a smaller square).
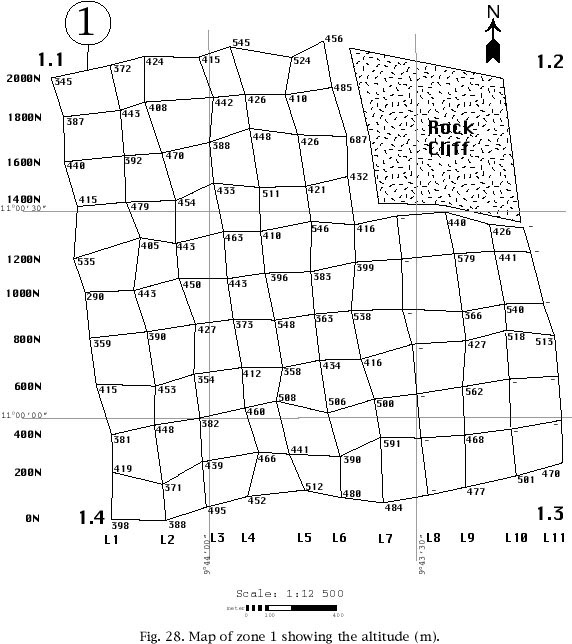
Figure 28 shows the altitude of each sample site and confirms the hilly nature of the terrain, with altitudes varying between 290 and 687 meters, excluding the rock cliff where the highest altitudes are present.
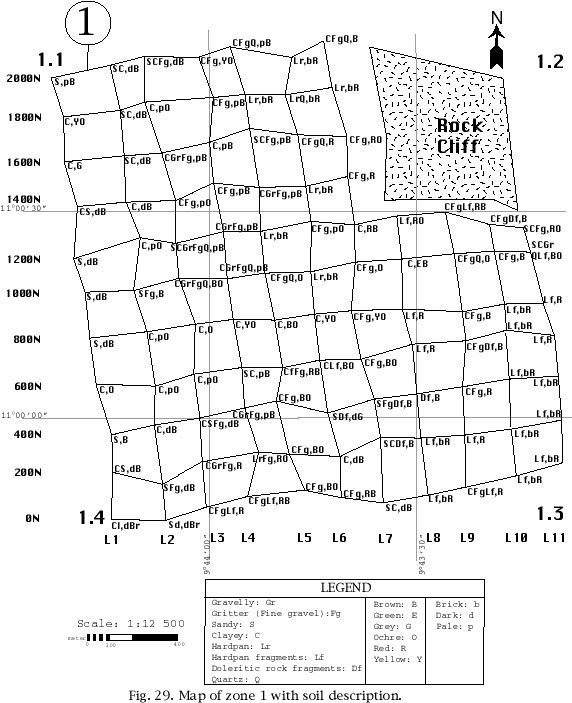
The granulometry and color of the soil samples collected is shown on figure 29. These features change very quickly from one sampling site to the other. However, it can be said that clay is the most common soil type with sand or gravel dominating in some areas. The soil color is usually ochre or brown.
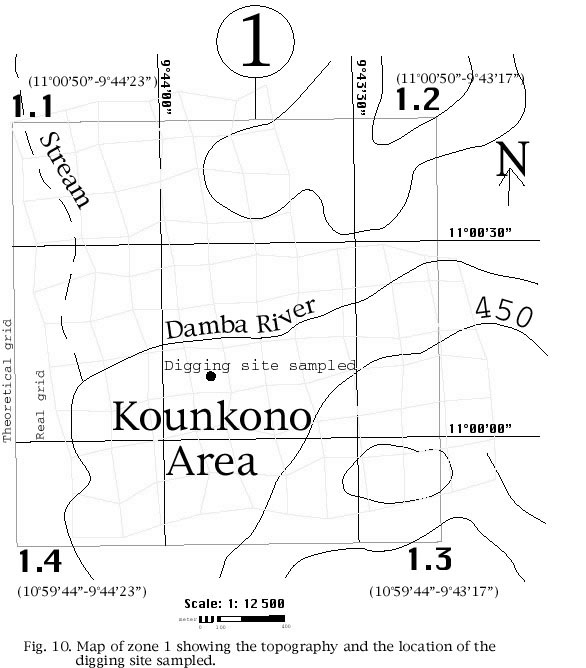
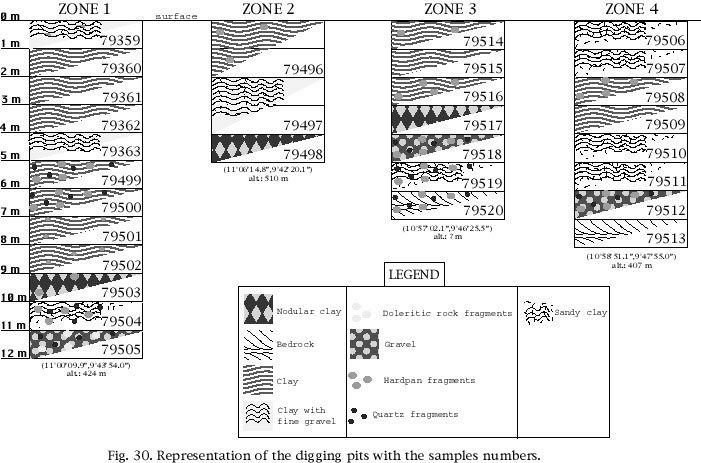
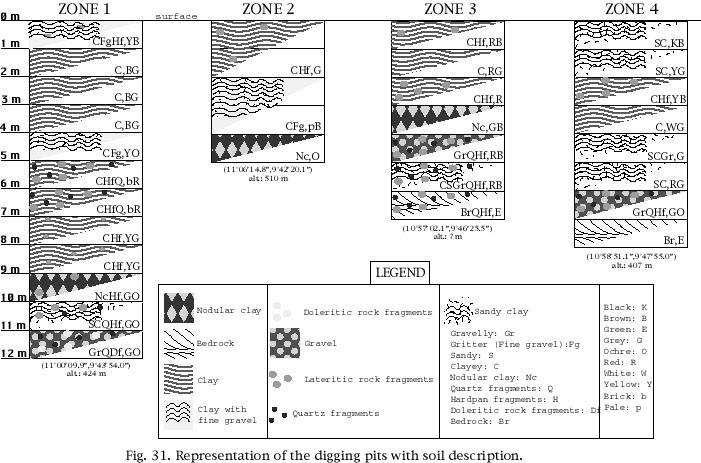
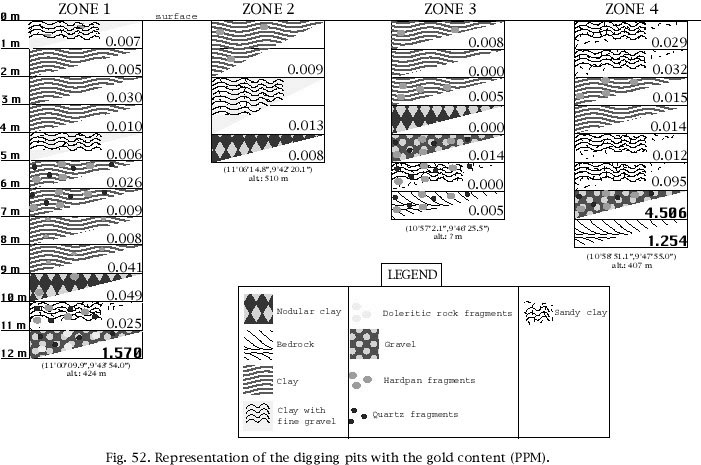
One digging pit was sampled in zone 1 (figure 10). Twelve channel samples, each representing a one meter vertical section of the lateritic profile, were collected in this pit (figure 30). Figure 31 shows the soil types encountered in this pit. Clay is the dominant material between surface and 10 meters, followed by sand (10 - 11 m) and gravel (11 - 12 m). Quartz fragments are present between 5 - 7 meters and 10 - 12 meters. Some fragments of dolerite were observed between 11 and 12 meters. The soil color is dominantly yellowish brown between 0 - 5 meters, brick red from 5 to 7 meters and ochre to yellow between 7 and 12 meters.
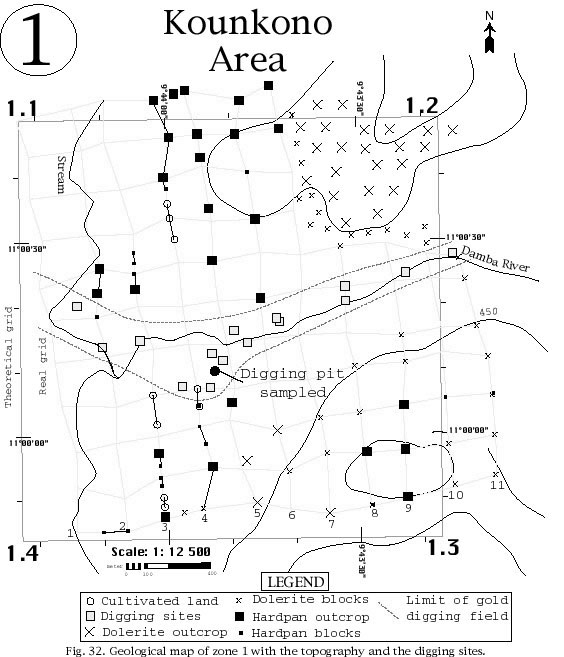
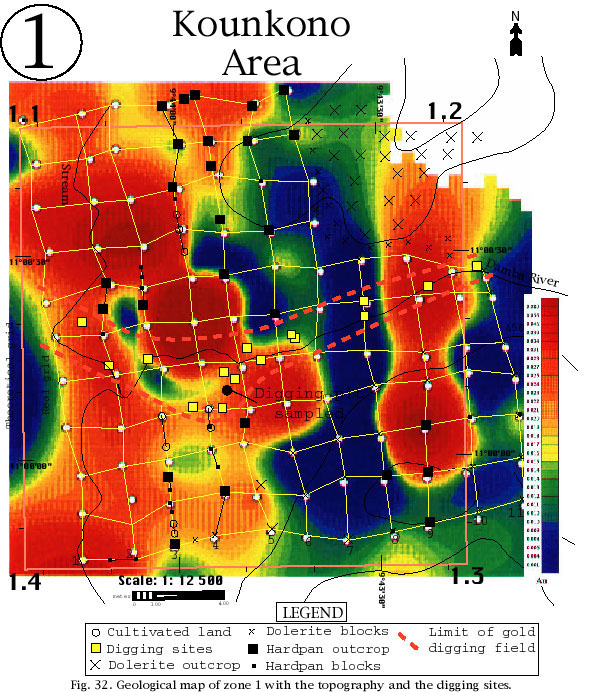
Figure 32 shows the geological and physiographical features of zone 1. These can be summarized as follows:
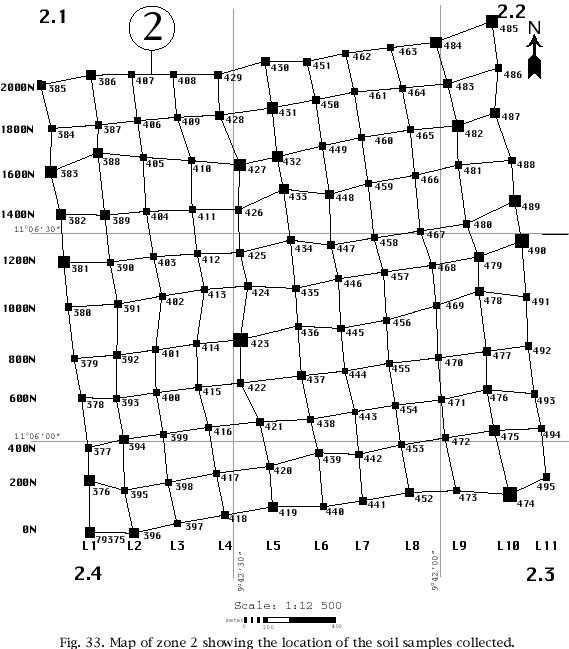
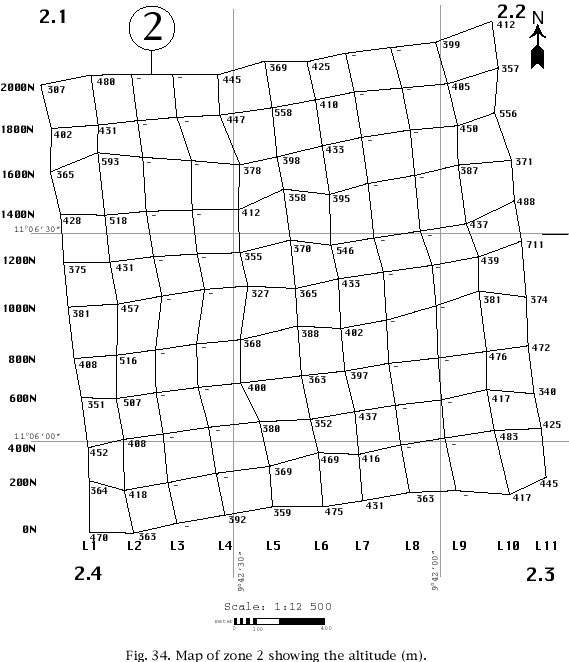
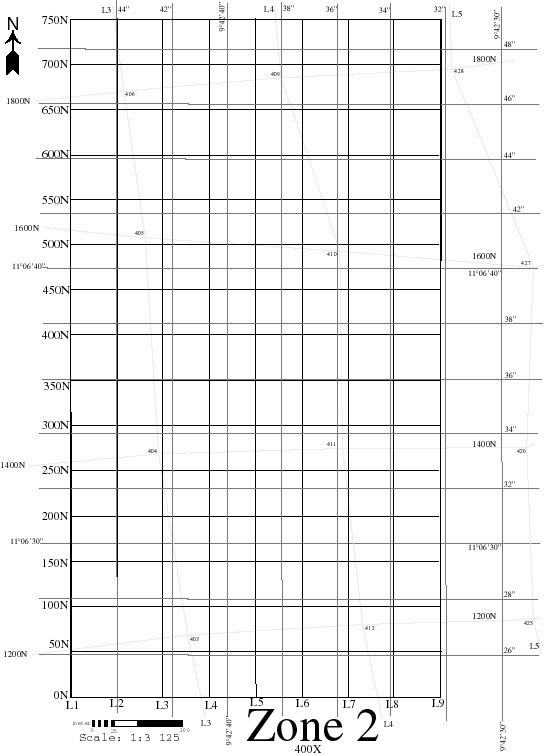
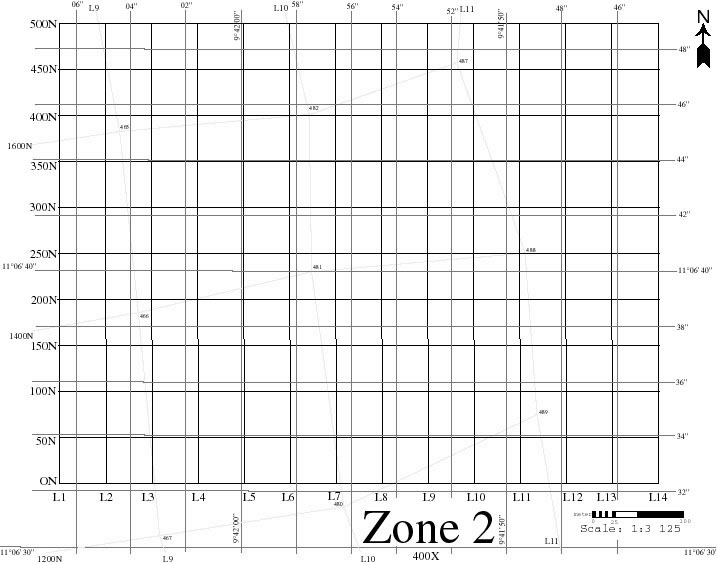
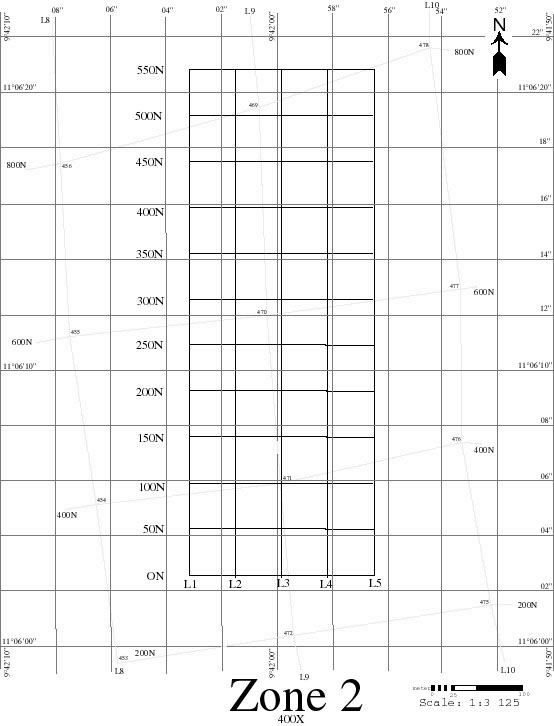
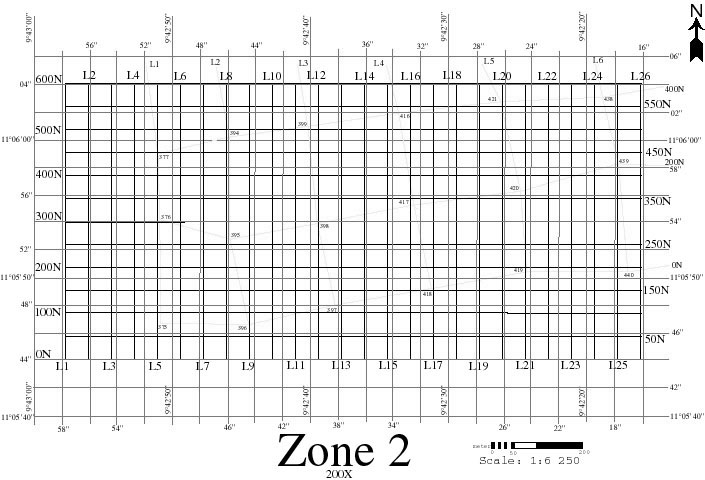
In zone 2, 121 soil samples (numbers 79375 to 79495) were taken in a relatively flat terrain (figure 33). Generally, zone 2 is not as hilly as zone 1. The altitudes vary between 307 and 711 meters, but most are between 350 and 450 meters (figure 34).
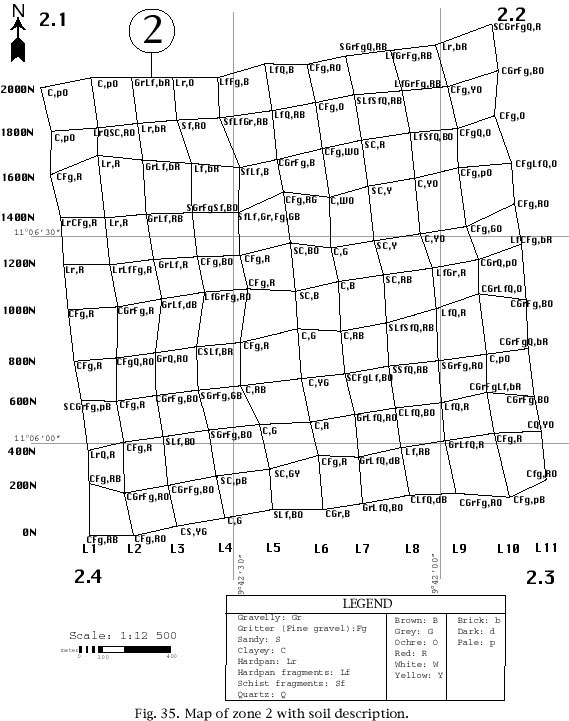
Types of soil are diversified, but clay is predominant everywhere (figure 35). Quartz, schist and hardpan fragments are ubiquitous. The soil color is dominantly ochre, brown or red.
One gold digging pit, 6 meters deep, was sampled in zone 2. Three vertical channel samples were collected, each representing a two meters section of the lateritic profile (figure 30). All these samples are dominantly composed of clay (figure 31). In the upper two meters, the clay contains some hardpan pebbles, while it acquires a nodular texture between 4 and 6 meters.
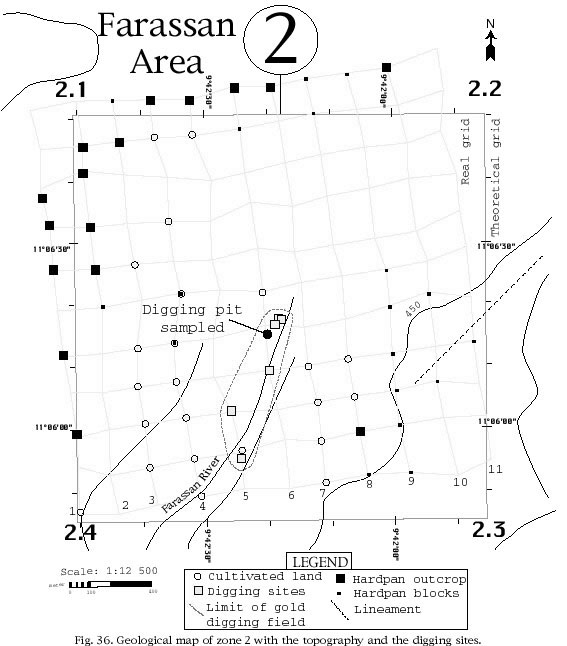
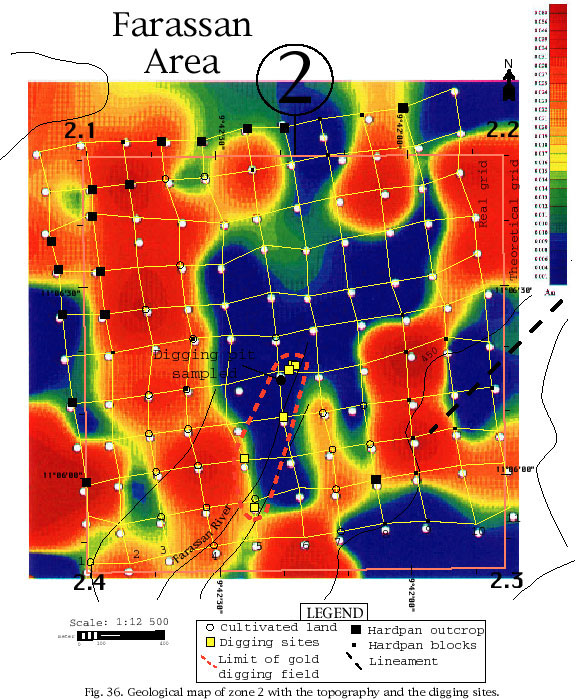
Figure 36 shows the geological and physiographical features of zone 2. These can be summarized as follows:
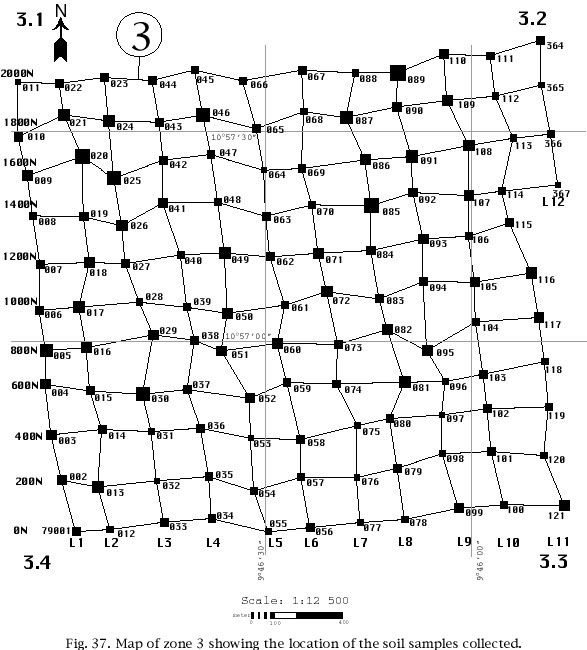
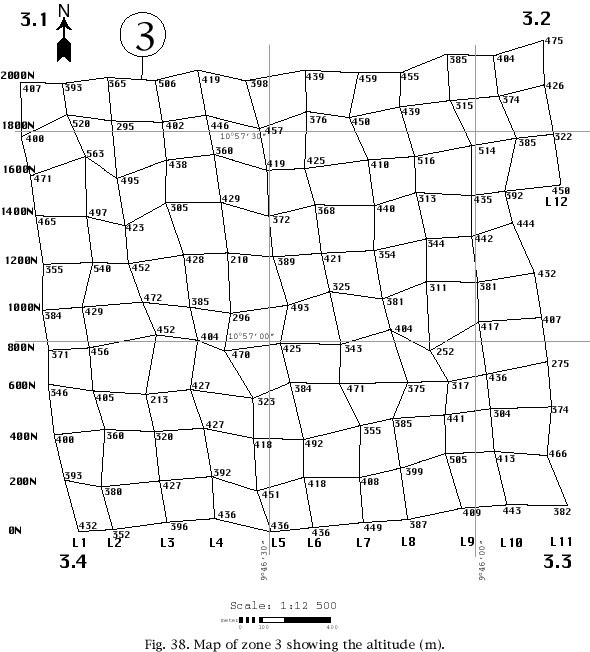
In zone 3, 125 soil samples were collected (figure 37). In addition to the 121 planned samples (numbers 79001 to 79121), four additional samples (numbers 79364 to 79367) were taken from an extra line located 200 meters to the east of line 11, between stations 1400 and 2000 North. This extra line was added because early results received from the ITS laboratory showed that sample 79112 (line 11, station 1800N) contained a very high gold value (see section 7.2.3). Therefore, it became important to check the possible extension of this gold in soil anomaly.
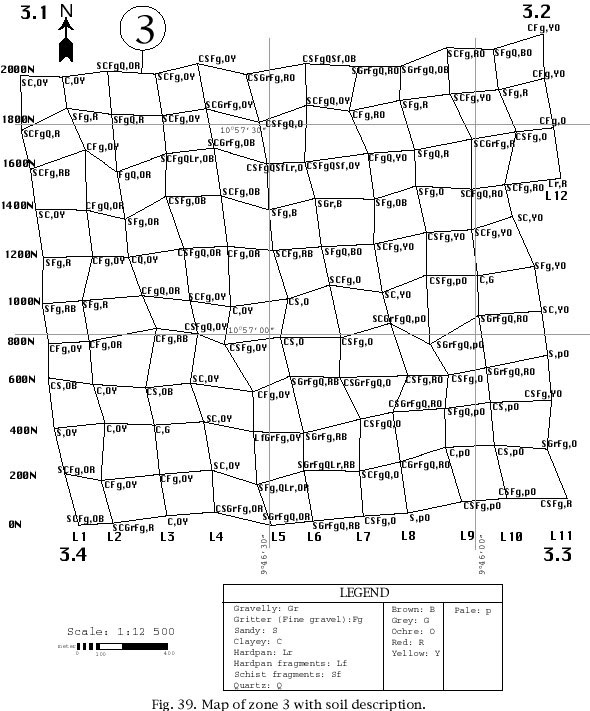
The altitude (figure 38) is rather uniform (275 to 540 meters) and the types of soil (Fig. 39) are dominantly clay and sand. Gravel is distributed randomly. Most of the time, the soil color is ochre or yellow with some brown, grey and red.
Seven vertical channel samples were collected in one digging pit measuring 7 meters deep (figure 30). In this pit, the lateritic profile is composed mainly of clay from surface to 4 meters deep; this clay becomes nodular between 3 and 4 meters. This is followed by gravelly material between 4 and 6, 5 meters, where the bedrock is reached (figure 31). Quartz fragments are present in the last three meters. The soil samples here are frequently red or brown, while the bedrock has a greenish color.
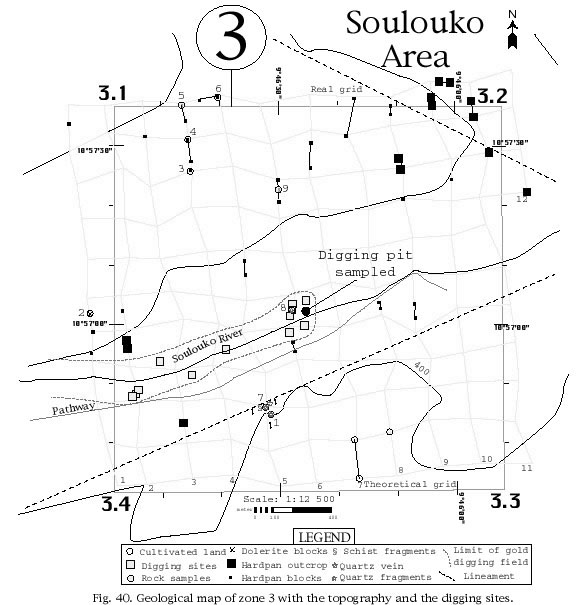
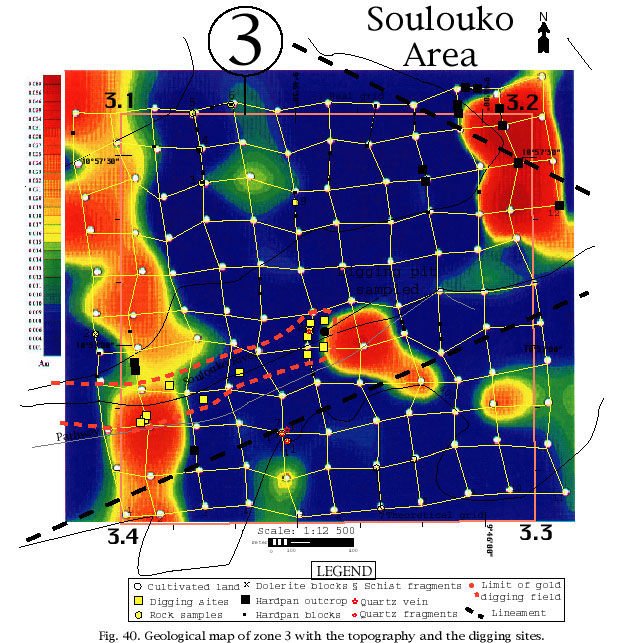
In addition to the soil samples, nine rock samples were collected within zone 3. The location of these samples is shown on figure 40 (numbers 1 to 9). Among these nine samples, three are metasedimentary schists (or schistose rocks), three are hardpan cappings, two are quartz veins and one is a dolerite. The analytical results (gold contents) from these samples are discussed in section 7.2.3.
Figure 40 shows the geological and physiographical features of zone 3. These can be summarized as follows:
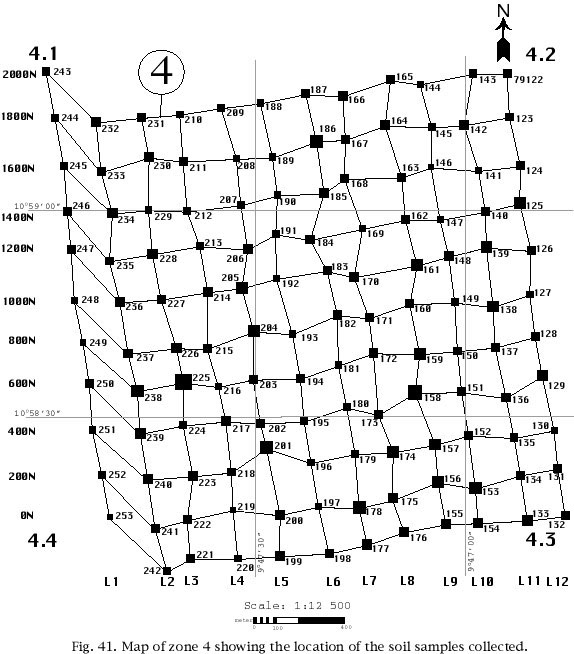
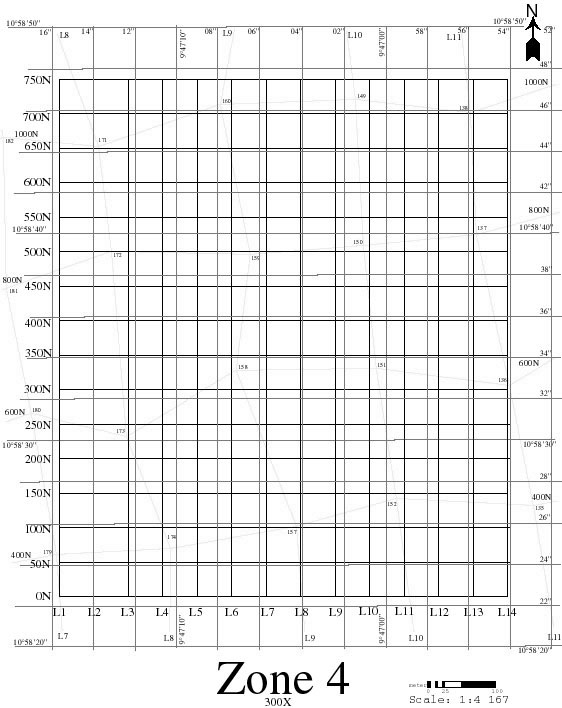
In zone 4, 132 soil samples were collected along 12 survey lines (figure 41). One survey line was added to the usual eleven lines, because it was felt that with the compass deviation, the 2 X 2 km target zone had not been completely covered.
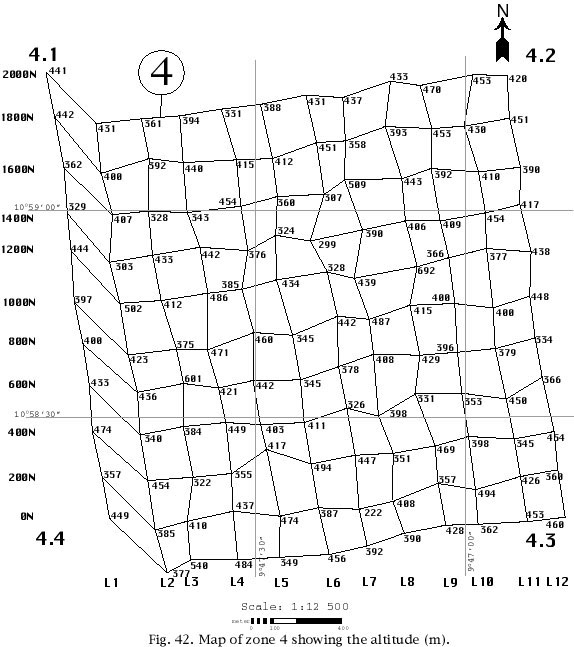
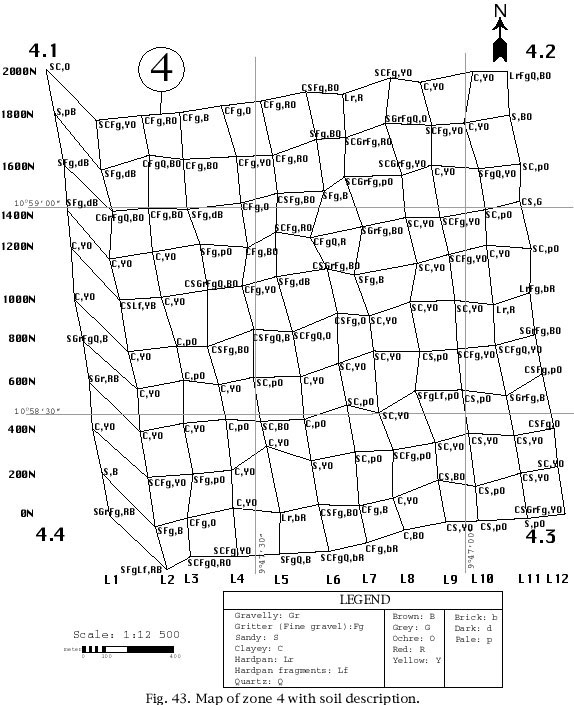
The altitude in zone 4 is relatively flat (figure 42). The lowest altitude is 222 meters and the highest altitude is 692 meters. This relatively large difference between the highest and lowest elevations, however, is not representative of a hilly terrain, since the slopes are relatively gentle. The soil is generally clayey, but sand is also common (figure 43). The soil color is usually ochre, but there are also a lot of yellow and brown tints.
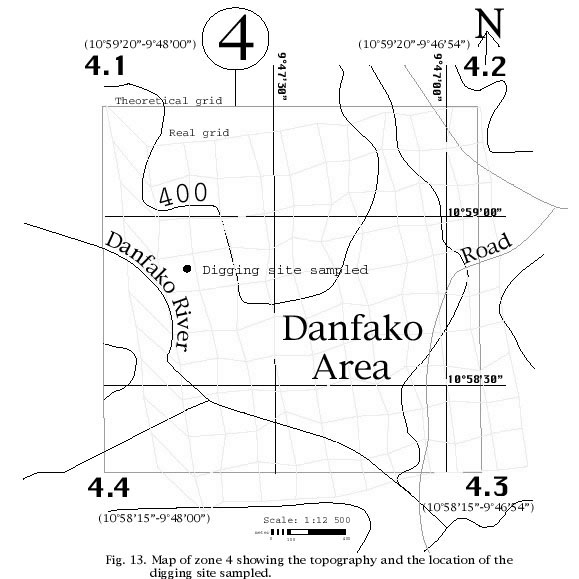
Eight samples (79506 to 79513) were taken from a digging pit in zone 4 (figure 13 and figure 30). Like in the other digging sites, most of the soil is composed of clay (figure 31). The upper 6 meters are composed of a mixture of clay and sand. The color is black for the first meter, due to the presence of organic material. Between 1 and 6 meters, it is of various brown and yellow tints. From 6 to 8 meters, the soil is a greyish gravel. The bedrock is reached at 8 meters and it has a greenish color.
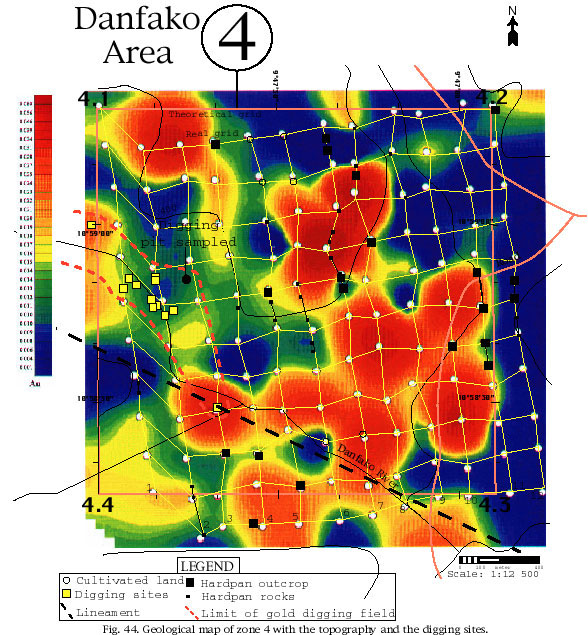
Figure 44 shows the geological and physiographical features of zone 4. These can be summarized as follows:
Based on the current gold digging activity taking place on the Heremakono permit and on the number and extension of the digging sites, the gold potential of this property appears very promising. This potential will be examined in the following sections of this report.
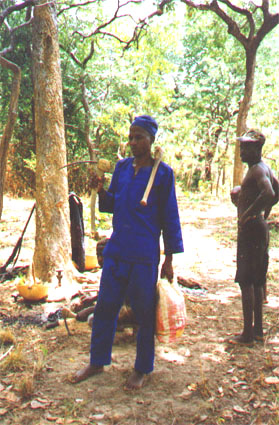
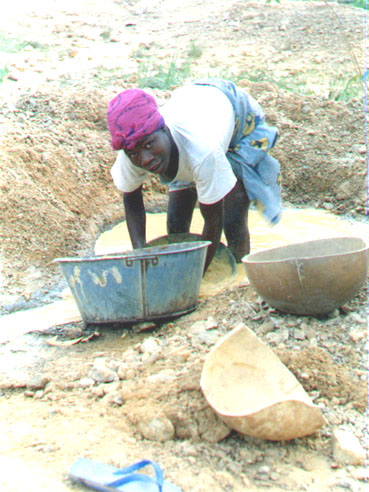
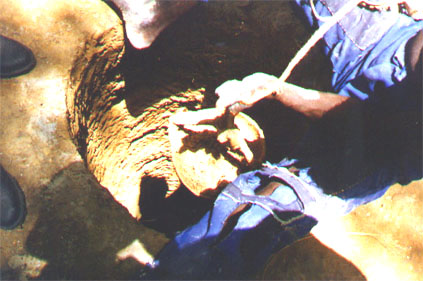
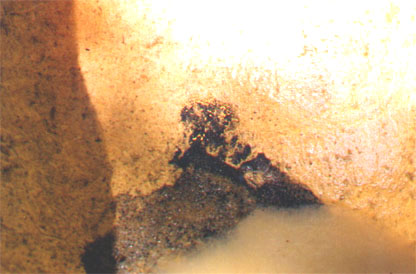
On all four survey zones, there is an important number of artisans digging the soil to find gold (figure 45: Gold digging pits are numerous in all four zones). They dig their circular pits with hand made picks (figure 46: Men dig holes with a special pick). Men usually do the digging, while women wash the gravel to concentrate the gold (figure 47: Women wash the auriferous soil extracted by men). The pits are usually 6 to 12 meters deep and the digger at the bottom of the pit fills a pail with the auriferous gravel, which is pulled at surface by a helper (figure 48: Gold digger pulling a pail of auriferous gravel towards the surface), and then handled to women for washing. The final concentrate often contains numerous gold nuggets (figure 49: Gold nuggets concentrated by washing the gravel).
Most of the gold digging fields are located along streams (figure 32, figure 36, figure 40 and figure 44). According to the gold diggers, gold is associated with a gravel horizon measuring 30 to 50 cm thick, and resting directly on top of the bedrock.
The geochemical survey, carried out in April and May 1997 shows some very significant anomalies that are discussed hereafter.
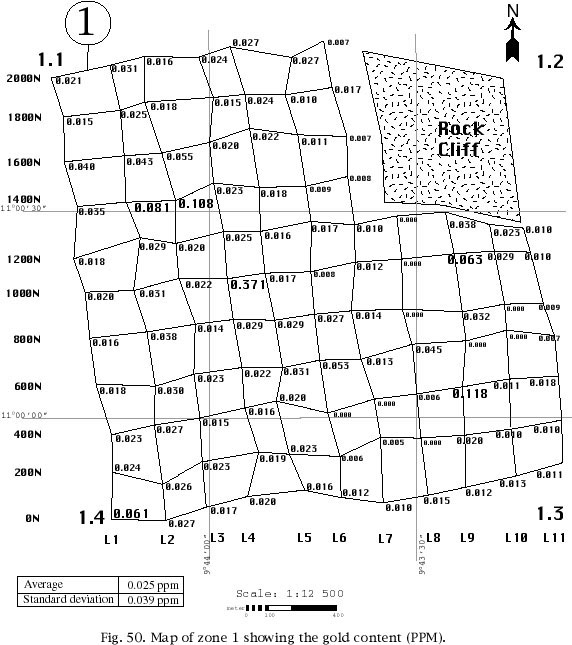
Among the 105 soil samples collected in zone 1, only 9 have gold values below the detection limit (identified as 0,000; figure 50). These very low gold values are located in the SE corner of the zone. Ten other samples have low values ranging between 6 and 9 ppb Au, and are also concentrated in the southeastern part of the zone, between lines 6 and 11. The vast majority of the samples (78) have gold contents ranging between 10 and 50 ppb, which appear to represent the background gold value for soils in this area. It is to be noted, however, that this background is significantly anomalous relative to barren greenstone terrains, where rocks average 1 to 5 ppb Au (Kwong and Crocket, 1978; Meyer and Saager, 1985). Five samples show clearly anomalous gold concentrations ranging between 50 and 100 ppb, while three others have gold contents superior to 100 ppb (108, 118 and 371 ppb respectively). Four of these eight values over 50 ppb (including the highest one at 371 ppb) are concentrated on lines 2 to 4, between stations 1 000 and 1 600 North.
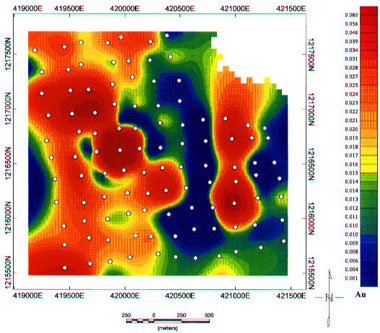
The average gold in soil value for zone 1 is 25 ppb with a standard deviation of 39 ppb. This high standard deviation with respect to the average value is normal for gold. This is due to the "nugget effect", which results in a limited number of high values strongly influencing the statistics of a large population. Figure 51: Color contoured map of the soils gold content in zone 1 (Kounkono) and figure 51a represent a color contoured map of the gold in soil values for zone 1. The GEOSOFT software was used to produce this map. It emphasizes the anomalous zones in warm colors (red) contrasting with the cold colors (blue) of the background values.
In the single gold digging pit sampled (figure 52), the gold content of the soil is 7 ppb on surface and generally increases with depth (30 ppb at 3 m, 41 ppb at 9 m and 49 ppb at 10 m) until the pay gravel horizon is reached, grading 1,57 g/t Au.
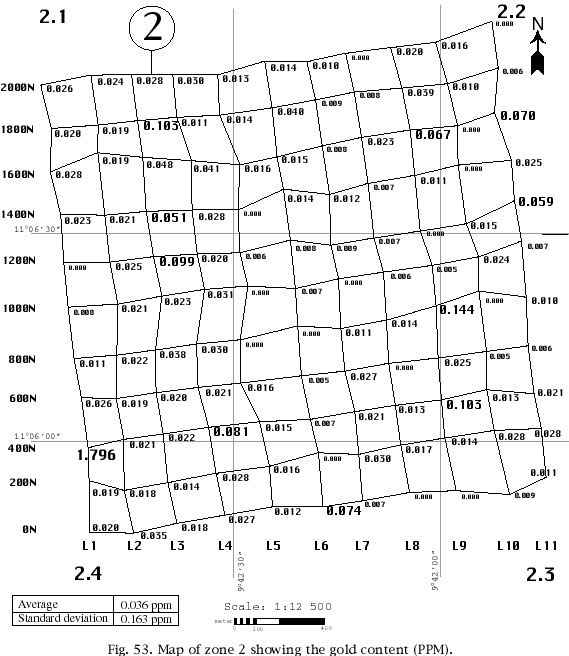
Among the 121 soil samples collected in zone 2, 36 have low gold contents ranging between detection limit and 9 ppb. These samples are concentrated in the eastern half of the sampling grid (figure 53). A majority of samples (74 or 61,2%) contain between 10 and 50 ppb gold, which seems to correspond to the background for the area. Seven samples have gold concentrations between 50 and 100 ppb, while four exceed one hundred ppb (103, 103, 144 and 1 796 ppb respectively). These eleven highly anomalous samples are distributed rather randomly within zone 1, although some concentrations of anomalous values can be defined on line 3 (between stations 1 200 and 1 800 N), line 9 (between stations 400 and 800 N) and lines 9 and 11 (between stations 1 200 and 1 600 N). Three high values (74, 81 and 1 796 ppb) are also present in the southwestern part of the survey grid, but each is separated from another by samples with background values.
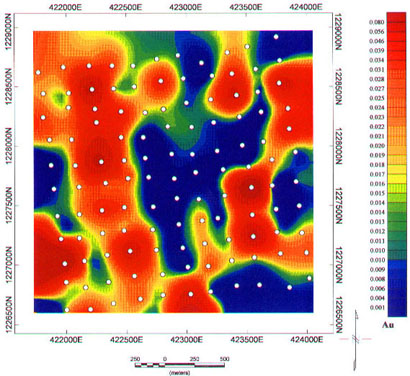
The average gold in soil value for zone 2 is 36 ppb with a standard deviation of 163 ppb. This very high standard deviation in comparison with the average value is essentially due to only one highly anomalous value at 1,80 g/t Au. Figure 54: Color contoured map of the soils gold content in zone 2 (Farassan) and figure 54a show the color contoured map of the gold in soil values for zone 2.
The only digging pit sampled within the zone was just six meters deep and yielded only low gold values ranging between 8 and 13 ppb (figure 52).
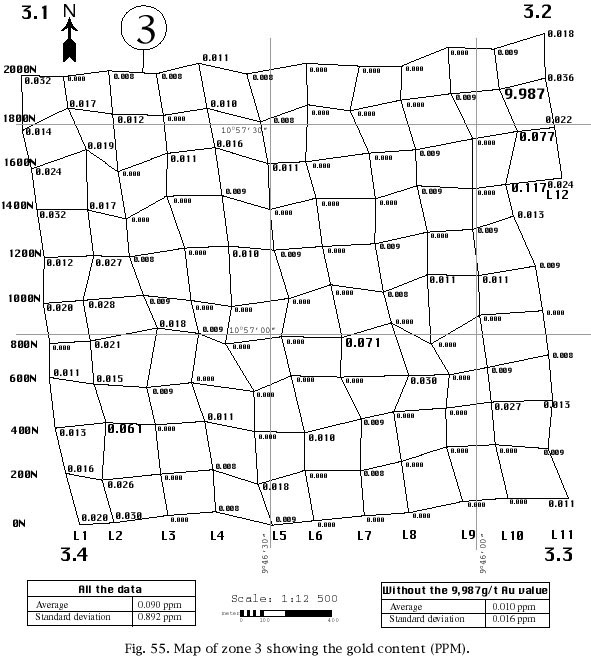
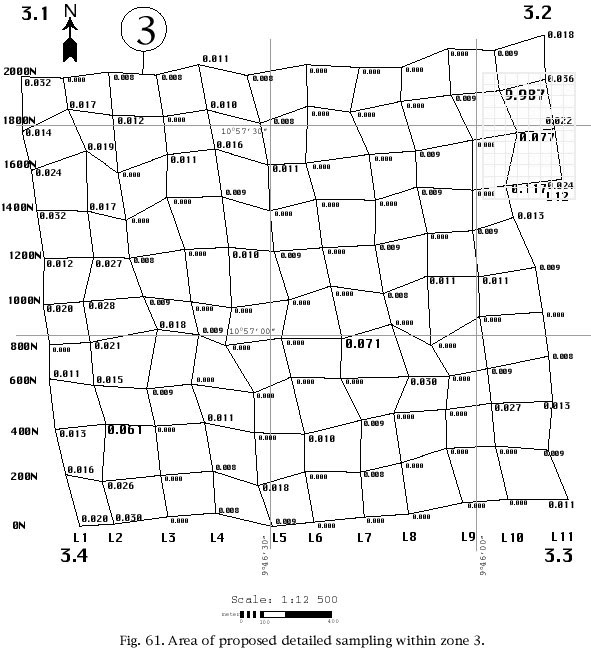
Zone 3 is distinctive from the three other survey areas by the fact that a much larger proportion of samples contain low gold values below 10 ppb (79 of 125 samples or 63,2%). The samples with gold concentrations between 10 and 50 ppb, which are dominant in the three other zones, amount to only 41 samples or 32,8% of the total number. Three samples have gold concentrations between 50 and 100 ppb, and two others have gold concentrations in excess of 100 ppb (117 and 9 987 ppb). The most interesting result from this zone is that three out of the five strongly anomalous values (>50 ppb) are adjacent in the NE corner of the zone (figure 55). Therefore, an anomalous zone of at least 400 meters long is present in this area and constitutes a significant exploration target for future work. As these anomalous results were received while the team was still in Guinea, an extra line (L. 12) was added to the basic grid in order to check the eastern extension of the anomalous zone. Unfortunately, the four samples collected on that extra line yielded only average gold values for the area (between 18 and 36 ppb).
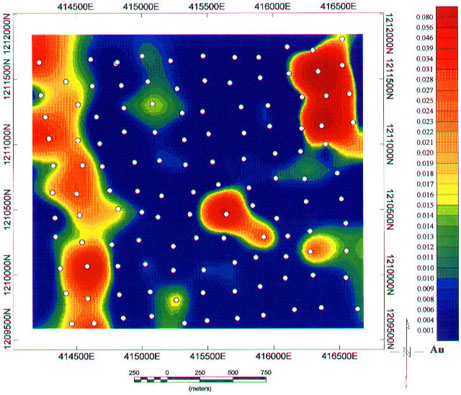
The average gold in soil value for zone 3 is 90 ppb with a standard deviation of 892 ppb. However, these excessive values compared to those from zones 1 and 2 are not significant, since they result from the presence of only one extreme value within the group (sample number 79112: 9.987 g/t Au). If this sample is excluded from the calculations, the average value drops to 10 ppb Au and the standard deviation to 16 ppb Au, which are significantly lower than the numbers for zones 1 and 2.
This predominance of low gold in soil values within zone 3 is clearly shown on the color contoured map (figure 56: Color contoured map of the soils gold content in zone 3 (Soulouko) and figure 56a) on which the low values (blue tints) dominate in comparison with zone 1 (figure 51) and zone 2 (figure 54).
The sole gold digging pit sampled within zone 3 was seven meters deep and yielded only low gold values ranging between detection limit and a maximum of 14 ppb (figure 52).
In addition to the soil and pit samples, nine rock samples were collected within zone 3. Their description, mineralogical composition and gold content are given in table I. The laboratory report is presented in appendix III. The gold in rock analyses were carried out by Metriclab (St-Joseph-du-Lac, Quebec) by fire assay.
Seven of the nine rock samples contain only slightly anomalous gold values ranging between 10 and 37 ppb. These include the quartz vein (number 1) and the enclosing schist (number 7) which outcrop along the presumed shear zone located in the southern part of zone 3 (figure 40). However, such a limited sampling does not mean that this lineament must be disregarded as a potentially auriferous structure. Two samples collected from hardpan blocks returned anomalous values of 73 ppb (number 6) and 229 ppb (number 4). These samples are located at the northern end of lines 4 and 5 (figure 40), where no significant gold in soil anomaly has been detected. However, some follow-up work could be done in order to locate the source of these hardpan blocks, since hardpan is known to preserve the geochemical signature (in this case: the anomalous gold content) of the bedrock from which it was formed.
|
|
|
|
|
|
|
|
|
|
|
|
|
|
|
|
|
|
|
|
|
|
|
|
|
|
|
|
|
|
|
|
|
|
|
|
|
|
|
|
|
|
|
|
|
|
|
|
|
|
|
|
|
|
|
|
|
|
|
|
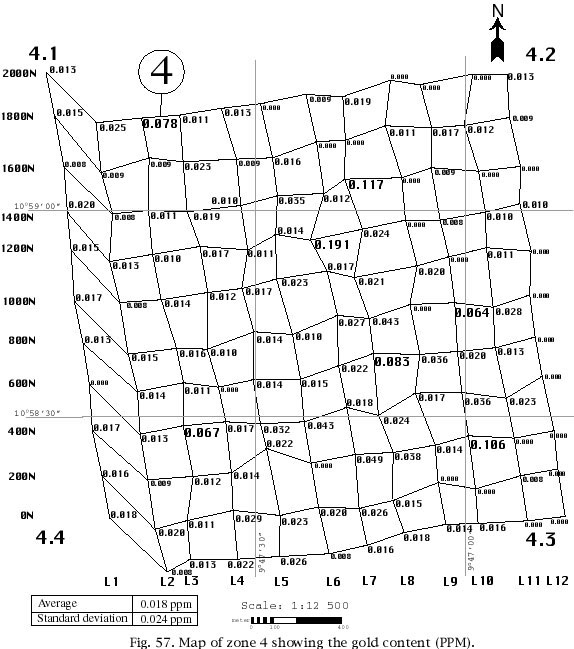
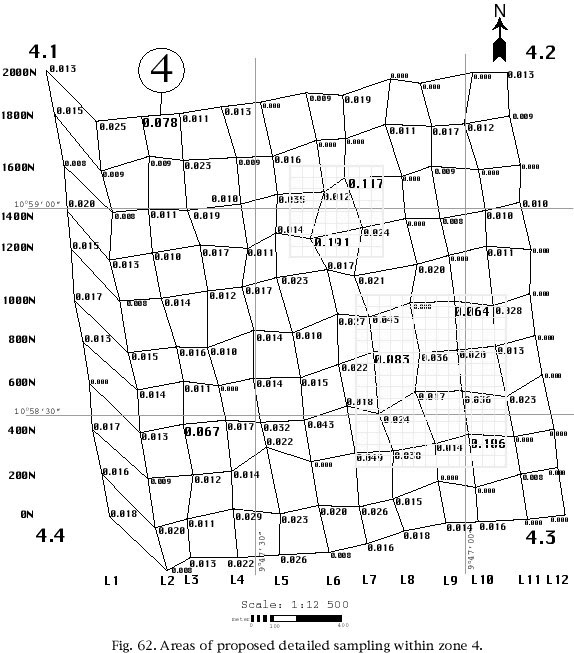
Figure 57 shows the gold content of the 132 soil samples collected in zone 4. Among these, 40 have low gold values under 10 ppb. The majority of the samples (85) contain average gold values for the Heremakono area, ranging between 10 and 50 ppb. Four samples have gold values between 50 and 100 ppb, while three others contain gold values in excess of 100 ppb (106, 117 and 191 ppb respectively). Five of the seven highest gold values are concentrated on lines 8 and 10, between stations 400 and 1600 North; the two other ones are isolated.
The average gold in soil value for zone 4 is 18 ppb with a standard deviation of 24 ppb. These numbers are somewhat lower than for zones 1 and 2, but this is essentially due to the fact that the highest gold in soil value within zone 4 is only 191 ppb, compared to 371 ppb for zone 1 and 1 796 ppb for zone 2.
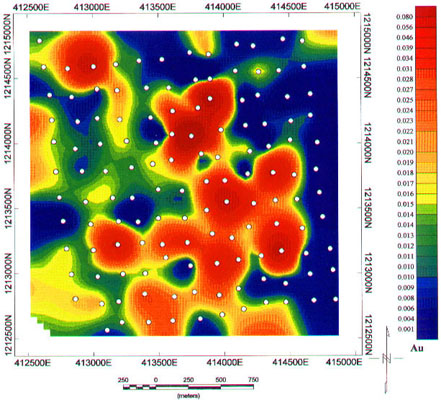
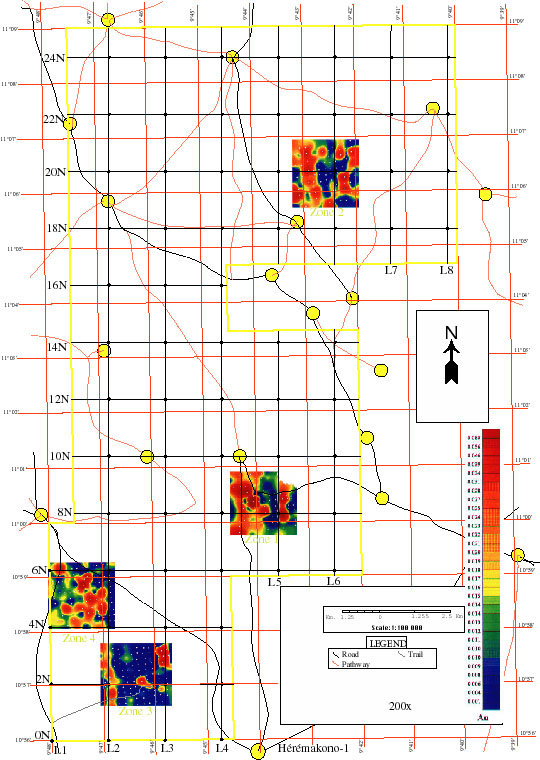
Figure 58: Color contoured map of the soils gold content in zone 4 (Danfako) and figure 58a show the color contoured map of the gold in soil values for zone 4. The examination of this map suggests an alignment of the anomalous values along a northwest striking trend extending from line 10, station 400N (sample 79152: 106 ppb) to line 3, station 2 000N (sample 79231: 78 ppb). This trend is somewhat parallel to the lineament observed on the Landsat image and to the course of the Danfako River (figure 44), and located some 600 to 1 000 meters to the NE of these features. Therefore, the gold in soil anomalies identified within zone 4 could be related to a NW striking fault zone belonging to the same deformation system that is at the origin of the gold mineralization along the Danfako River.
The only gold digging pit sampled within zone 4 yielded very interesting results. The gold content of the soil first decreases from 29 ppb on surface to 12 ppb at a depth of five meters, before increasing to 95 ppb in the sandy clay horizon resting on the pay gravel at a depth of 6 meters. The gold contents then sharply increases to ore grades of 4,51 g/t Au in the auriferous gravel horizon and 1,25 g/t Au in the underlying bedrock.
The extensive gold digging fields present on the Heremakono permit and the high average gold content of the soils (10 to 50 ppb) compared to barren greenstone terrains (1 to 5 ppb) attest of the potential of this area to host industrially exploitable gold deposits. However, this potential does not rely upon the thin horizon of auriferous gravel (30 to 50 cm thick) exploited by the gold diggers. This gravel horizon appears to represent a paleoplacer deposited directly on the bedrock in past time and later buried under barren material during seasonal periods of flooding along the actual river banks. Therefore, if these deposits are of alluvial origin, like they seem to be, the interest lies in finding their source rather than exploiting them directly, which cannot be a profitable operation on a large scale because of the limited thickness of the deposits and the huge volume of barren material covering them.
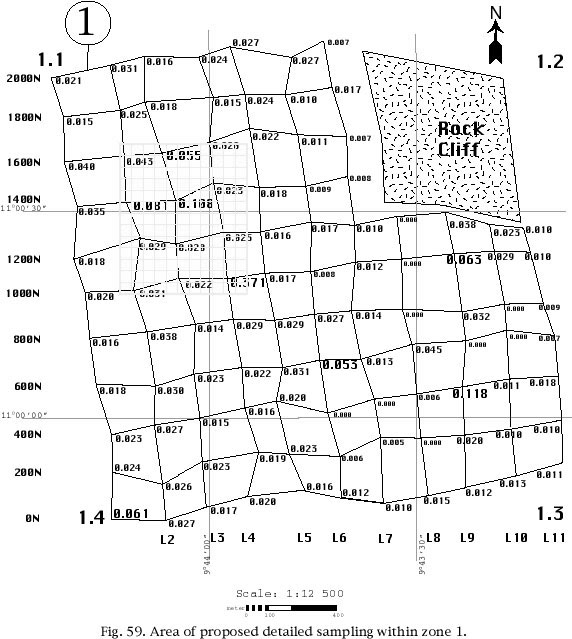
On the other hand, gold soil anomalies found on higher ground, away from the river beds, appear much more prospective, because they may be of eluvial origin (residual geochemical anomalies directly rooted to the underlying bedrock). Therefore, future work should be aimed at outlining more accurately these gold in soil anomalies, and then test their eluvial origin by drilling underneath. In all four zones, significant gold anomalies in soil have been identified and warrant a more detailed sampling program on a 50 X 50 meters grid.
In zone 1, four of the eight gold values higher than 50 ppb are concentrated within a 550 X 650 meters zone, while the four others are isolated. Therefore, one area is retained for additional sampling (figure 59 and figure 59a).
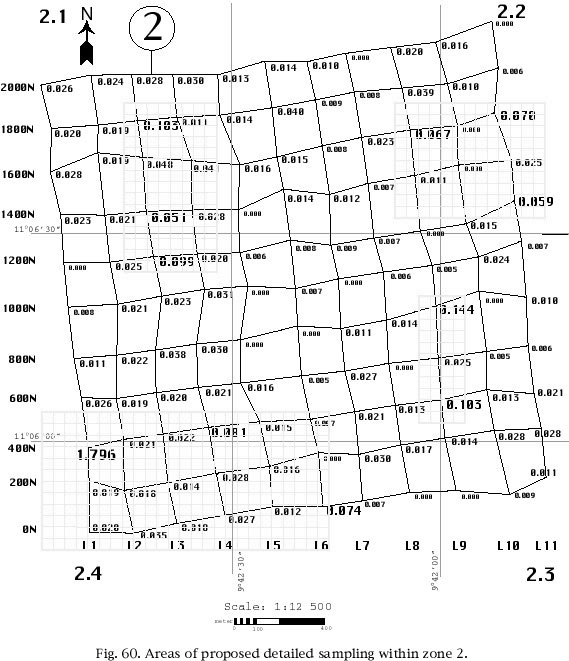
In zone 2, the highly anomalous gold values (>50 ppb) are concentrated in four distinct areas (figure 60, figure 60a, figure 60b, figure 60c and figure 60d)
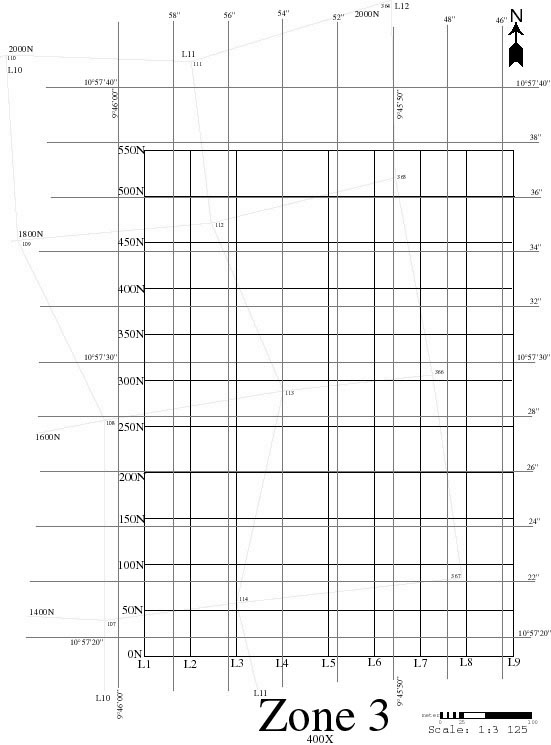
In zone 3, three out of the five highest gold anomalies are concentrated in the northeastern corner of the grid, while the two others are isolated, defining a single zone for follow-up work, measuring 550 meters N-S by 400 meters E-W (figure 61 and figure 61a)
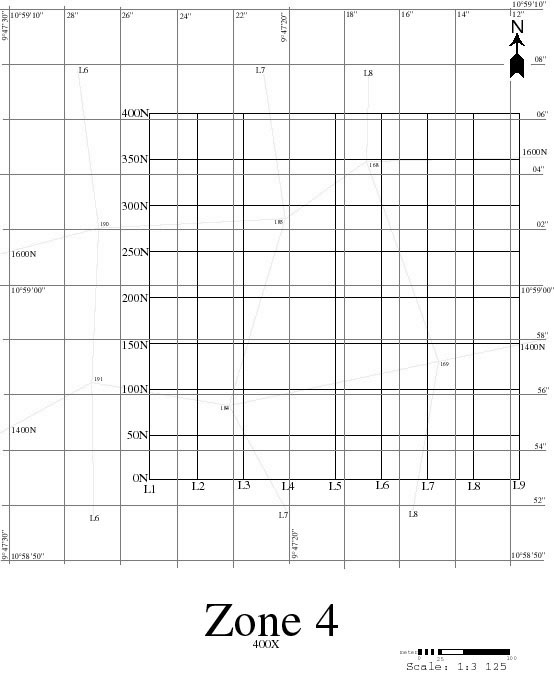
In zone 4, five out of the seven highest gold concentrations occur in two neighbouring zones, while the two other ones are isolated. Therefore, two areas measuring respectively 650 X 750 meters and 400 X 400 meters warrant a tighter samplin (figure 62, figure 62a and figure 62b)
The sampling of four gold digging pits by means of vertical channel samples demonstrated that the material exploited by the gold diggers is a thin horizon (30 - 50 cm) of auriferous gravel directly overlying the bedrock and overlain by barren laterite.
Two hardpan samples located within zone 3 yielded anomalous gold values of 73 and 229 ppb. Some follow-up work could be done in order to find the source of these hardpan blocks.
Before C. Plouffe's mission in April 1996 and this last mission in April-May 1997, the Heremakono area had never seen any systematic exploration work and its mining potential was largely unknown. In order to compensate this lack of information, a sound evaluation campaign should start with the basic exploration tools such as an airborne geophysical survey (magnetic, electromagnetic and radiometric methods), the study of satellite images (suggested scale 1:50 000) and the interpretation of air photographs (suggested scale 1:10 000). In this regard, the following information is relevant:
The study of these documents should clarify the main lithological and structural features of the permit area and help with the preparation of the next mission. This next campaign should be carried out in October and November 1997 (after the rain season) and consist of additional geochemical surveys in a first phase. Following the interpretation of this geochemical survey, a second phase consisting of reverse circulation drilling on the best anomalies should be undertaken in the beginning of 1998
Phase I, budgeted at 116 630$, should include the following geochemical surveys:
|
zone 1 (figure 59): |
= 168 samples; | |
|
zone 2 (figure 60): |
one 600 m (N-S) X 1250 m (E-W) grid one 750 m (N-S) X 400 m (E-W) grid |
= 338 samples; = 144 samples; = 154 samples; = 60 samples; |
|
zone 3 (figure 61): |
= 108 samples; | |
|
zone 4 (figure 62): |
= 224 samples; = 81 samples; | |
|
|
Total |
= 1277 samples |
This detailed geochemical survey will allow the definition of accurate drilling targets which will be tested in a second phase, in the beginning of 1998.
This phase II, budgeted at 154 780$, will consist of 1 000 meters of reverse circulation drilling (RCD) on the best geochemical anomalies. For this first drilling program, RCD is recommended because it is much cheaper (around half price) than diamond drilling. Furthermore, this first drilling program should test the first 40 to 50 meters of the lateritic profile, to check if the soil anomalies are related to bedrock mineralization and if the saprolite overlying the orezone is auriferous and amenable to open pit exploitation. Therefore, as very little fresh rocks will be encountered in these first 40 - 50 meters, RCD is considered as the most appropriate drilling method. The detailed cost of these two phases of exploration is given hereafter:
Phase I: Geochemical surveys (October-November 1997)
|
Field work in Guinea: |
|
|
|
|
|
|
|
Two Canadian geologists: |
2 x 35 days x 350$/day: |
24 500 $ |
|
Two airplane tickets (economy class): |
2 x 2 700$: |
5 400 $ |
|
One Guinean geologist: |
35 days x 100$/day: |
3 500 $ |
|
Two drivers: |
2 x 35 days x 50$/day: |
3 500 $ |
|
Three local workers: |
3 x 35 days x 15$/day: |
1 575 $ |
|
Preparation of mission logistics by a Guinean agent: |
10 days x 560$/day: |
5 600 $ |
|
Rental of two 4-wheel drive vehicles: |
2 x 35 days X 150$/day: |
10 500 $ |
|
Gold analyses: |
1 500 samples x 15$/sample: |
22 500 $ |
|
Living expenses for Canadian geologists: |
2 X 35 days x 60$/day: |
4 200 $ |
|
Camp equipment: |
|
5 000 $ |
|
Other expenses (vaccines, taxis, communications, documentation, ...): |
|
3 725 $ |
|
Contingencies: |
15% of 90 000$ above |
13 500 $ |
|
Sub-total: |
|
103 500 $ |
|
|
|
|
|
Report production in Canada: |
|
|
|
|
|
|
|
Canadian geologist: |
12 days x 350$/day: |
4 200 $ |
|
Draftsman: |
2 days x 350$/day: |
700 $ |
|
Secretary: |
1 day x 250$/day: |
250 $ |
|
Other expenses (communications, report printing, etc.): |
|
350 $ |
|
Sub-total: |
|
5 500 $ |
|
|
|
|
|
TOTAL (before GST) |
|
109 000 $ |
|
GST (7%) |
|
7 630 $ |
|
GRAND TOTAL |
|
116 630 $ |
Phase II: Reverse Circulation Drilling (January 1998)
|
Field work in Guinea: |
|
|
|
|
|
|
|
Reverse circulation drilling: |
1000 meters X 70$/meter: |
70 000 $ |
|
Gold analyses: |
1 000 samples x 15$/sample: |
15 000 $ |
|
Two Canadian geologists: |
2 x 25 days x 350$/day: |
17 500 $ |
|
Two airplane tickets (economy class): |
2 x 2 700$: |
5 400 $ |
|
One Guinean geologist: |
25 days x 100$/day: |
2 500 $ |
|
One driver: |
25 days x 50$/day: |
1 250 $ |
|
Two Guinean helpers: |
2 x 20 days x 15$/day: |
600 $ |
|
One 4 X 4 truck (including fuel): |
25 days X 150$/day: |
3 750 $ |
|
Hotel and living expenses: |
2 X 25 days x 60$/day: |
3 000 $ |
|
Camp equipment: |
|
1 000 $ |
|
Other expenses: |
|
1 000 $ |
|
Contingencies: |
15% of 121 000$ above |
18 150 $ |
|
Sub-total: |
|
139 150 $ |
|
|
|
|
|
Report (same as for phase I) |
|
5 500 $ |
|
|
|
|
|
TOTAL |
|
144 650 $ |
|
+ GST (7%) |
|
10 130 $ |
|
GRAND TOTAL |
|
154 780 $ |
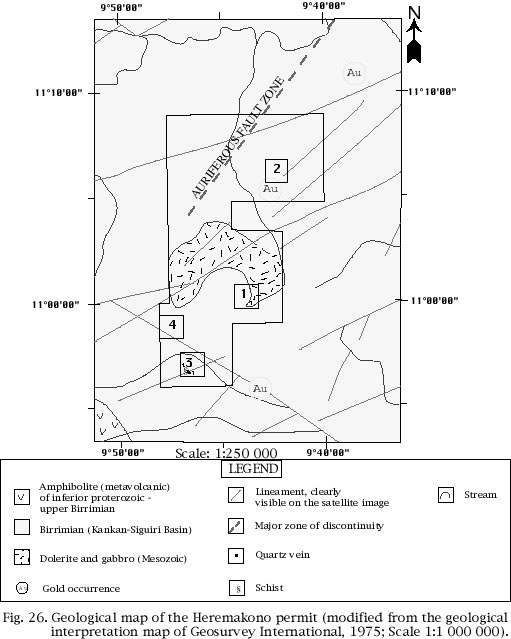
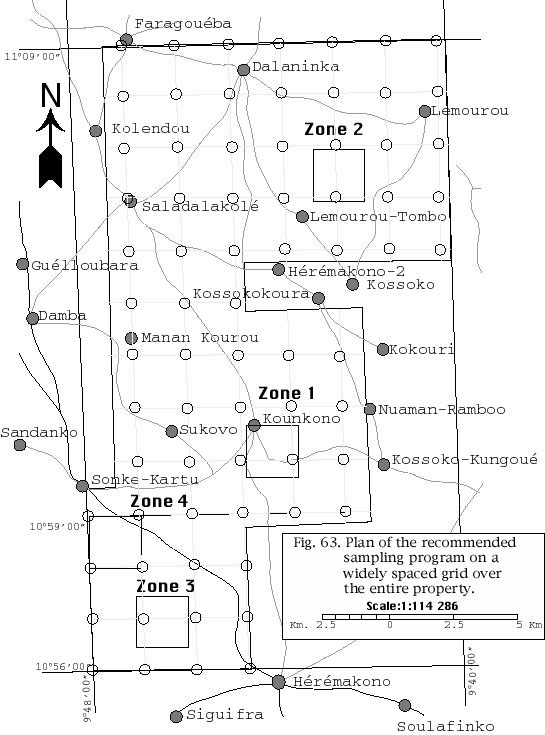
Chalice Mining Inc. holds an option to acquire a 250 km2 exploration permit in the Heremakono area, in northeastern Guinea. In April-May 1997, geological mapping and soil sampling on a 200 X 200 m grid were carried out on four target areas (each covering 4 km2) surrounding active gold digging sites identified during a previous reconnaissance mission in early 1996. Four hundred and eighty-three (483) soil samples were collected during the mission, in addition to 30 vertical channel samples distributed in four gold digging pits. Nine rock samples were also analyzed for gold. The area is mostly overlain by metasedimentary rocks of Birrimian age, with a large dolerite intrusion covering the central part of the permit. Except for the more resistant dolerite, which forms prominent hills, there is little outcrop in the surveyed areas. However, some small outcrops of schists invaded by quartz veining have been observed. A hardpan capping tops the lateritic soil profile in many places. This lateritic soil is composed mainly of clay minerals and generally measures some 10 meters thick.
In each of the four target areas (figure 63a), significant gold in soil anomalies were outlined, with the highest values ranging between 191 ppb and 9.99 g/t Au. The average gold content of the soils is usually in the 10 to 50 ppb range. The gold digging pits are largely concentrated along the river beds. Along the Damba River (zone 1), the Farassan River (zone 2), the Soulouko River (zone 3) and the Danfako River (zone 4), the gold diggers exploit a thin horizon of auriferous gravel (30 to 50 cm thick) resting directly on the bedrock, and overlain by some 10 meters of barren laterite. This thin layer of gravel cannot be profitably exploited on an industrial basis; however, it indicates the presence of gold in the surrounding area. Of greater interest are the soil geochemical anomalies that could be of eluvial origin and rooted to gold mineralization in the underlying bedrock.
Considering the high auriferous potential of Chalice Mining permit, an exploration program amounting to 271 410$ is proposed. Phase I of this program will consist of detailed geochemical surveys over the previously outlined anomalies, in order to define accurate drilling targets. The entire property should also be covered by a regional mapping program with soil sampling on a 2 km X 2 km grid, in order to gain an overall view of the property mining potential. Phase II should consist of 1 000 meters of reverse circulation drilling on the best geochemical anomalies, in order to establish their relation with underlying bedrock mineralization.
BOWELL R.J., AFREH, E.O., LAFFOLEY N. D'A., HANSSEN E., ABE S., YAO R.K. and POHL D. (1996) : Geochemical Exploration for gold in tropical soils - four contrasting case studies from West Africa. Trans. Instn Min. Metall. (Sec.B: Appl. earth sci.), 105, January - April 1996.
B.R.G.M. - GUINÉE (1975) : L'or en Guinée, bilan de nos connaissances sur la géologie et les ressources minières. Synthèse, 12 pages.
DELBOS L. and NORMAND D. (1983) : Programme quinquennal de prospection des minéraux de la République Populaire Révolutionnaire de Guinée. Bureau de Recherches Géologiques et Minières (BRGM), financé par: La Banque Mondiale, 232 pages.
GARACHTCHOUK V. and MIKHAILOV B. (1963) : Carte tectonique schématique de la Guinée et des territoires contigus, échelle 1:1,250,000. Technoexport, Groupe de spécialistes soviétiques, contrat no. 310, Ministère du développement économique, Direction Générale de l'Industrie, des Mines et de la Géologie.
GEOSURVEY INTERNATIONAL (1975) : Interprétation géologique des images Landsat. Map at the 1:1 000 000 scale published by the Ministry of Mines and Geology of Guinea.
GOLOUBINOW, R. (1935a) - Rapport de prospection aurifère sur le cours du Lélé, 1934-35. - Rapport Dir. féd. - Mines Dakar, 3 pages.
GOLOUBINOW, R. (1935b) : - Prospection aurifère en Guinée, 1935. - Rapport Dir. féd. - Mines Dakar, 47 pages.
GOLOUBINOW, R. (1950) : Notice explicative sur la feuille Kankan-Est (No. NC 29 No. - E. 26), 28 pages.
KWONG, Y.T.J. and CROCKET, J.H. (1978) : Background and anomalous gold in rocks of an Archean greenstone assemblage, Kakagi Lake area, northwestern Ontario. Econ. Geol. 73, pages 50 to 63
MEYER, M. and SAAGER, R. (1985) : The origin of gold in Archaean epigenetic gold deposits. Econ. Geol. Res. Unit, Univ. Witwatersrand, Inf. Circ. 172.
MILESI J.P., FEYBESSE J.L., LEDRU P., DOMMANGET A.,OUEDRAOGO M-F., MARCOUX E., PROST A., VINCHON C., SYLVAIN J-P., JOHAN V., TEGYEY M., CALVEZ J-Y., LAGNY P., (1989) : West African Gold Deposits in their Lower Proterozoic Lithostructural setting. Chron. Rech. Min., 497, 97 pages.
PLOUFFE, C. (1996) : Evaluation of the gold potential of the geological reconnaissance zone owned by the Patrician Gold Mines Ltd and Chalice Mining Inc., Joint Venture located in Kouroussa - Siguiri area of Republic of Guinea, West Africa. Report submitted to « Patrician Gold Mines Ltd and Chalice Mining Inc., Joint Venture», 61 pages and 2 maps.
SAGATZKY J., (1953) : Indices de Minéralisation - Feuille Kankan -E au 1:500,000, 17 pages.
TECHNOEXPORT (1963) : Russian's synthesis report on gold and diamond with one map at the 1:1,250,000 scale.
WRIGHT ENGINEERS LTD, TORONTO, CANADA (1984) : Projet de placer d'or de Didi, Guinée, Afrique. Étude technique et économique, Volume I - Sommaire Exécutif, projet No. 3010. Pour le Ministère des Mines et de la Géologie et Chevaning Mining and Exploration Ltd.
This is to certify that:
� I am a professional geologist with my permanent residence located at 66 Sherbrooke street West, Montreal, Province of Quebec, Canada;
� I obtained my B.Sc. degree at Laval University in 1996 (see certificate);
� I have been practicing since my graduation;
� I carried out the geological evaluation of Chalice Mining Inc. exploration permit in the Heremakono area between April 21 and May 25, 1997.
� All the information contained in this report is exact, to the best of my knowledge, and I am solely responsible for the interpretations presented herein;
� I have no interest in Chalice Mining Inc. and I do not anticipate to have any in the future.
Serge Fortin, B. Sc., Geologist
Montreal, July 28, 1997
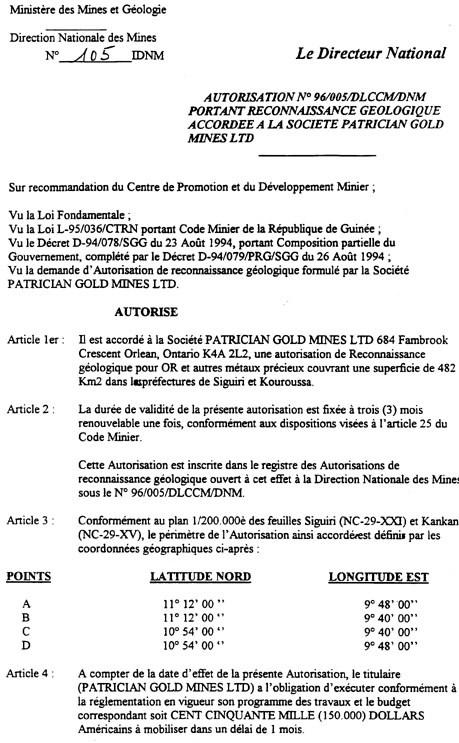
Ministerial decree granting the exploration permit (page 1 and page 2)
May 12, 1997
ITS
Intertek Testing Services
Fire Assay:
Fire assaying is a branch of quantitative analytical chemistry in which precious metals, gold, silver and some platinum group metals (currently only gold determinations are offered in Mandiana) are determined in soils, ores and other metallurgical products.
Fire assay of gold depends mainly on:
The Mandiana Laboratory offers fire assay analysis to clients. Samples are received, prepped (crushed, split, and pulverized) and analyzed on site. Depending of the needs of the client a 30 or 50 g pulverized sample is assayed along with the appropriate number of standards and blanks. The actual furnace fusion requires approximately 1.25 hours, and the extraction efficiency, under ideal conditions, is considered to be a total gold determination (near 100%).
Fire assay is the preferred method for gold analysis throughout the world, however due to the relatively high cost, when compared to other available methods, clients may choose the less expensive, and slightly less reliable/accepted methods such as aqua regia, depending on their needs.
Aqua Regia:
Aqua regia is an acid digestion technique (hydrochloric, nitric) used for the determination of gold in soils, and low grade ores. This method of gold determination is not adequate for high grade ores.
Mandiana offers three different aqua regia analyses to clients. The difference is primarily with sample size and volume of organic solvent (DIBK) used, resulting in slightly different detection limits.
The general method is as follows:
Aqua regia is suitable for gold determinations within defined analytical ranges (0.005 ppm to 80 ppm).The method is generally accepted throughout the mining community for exploration purposes only.
Active Cyanide Leach:
Active cyanide leach is a relatively simple and cheap method for extracting gold from soils, sediment and ore samples. The method is not considered to be a total gold extraction method, and is expressed as "bulk leach extractable gold". It is generally accepted that @85 % of the gold contained within a sample is recovered. This method is primarily used when cyanide heap leach applications are being considered for gold extraction and recovery at a potential or operational mine site.
Benefit: large samples can be used (500 g as opposed to 30 or 50 g) which gives more representative results. This method is generally not used for exploration purposes.
Analytical results (see SIDAM)
Description of soil samples and of samples collected in the gold digging pits, by numerical order (see SIDAM)
UTM coordinates for all the samples collected during the April - May 1997 mission (see SIDAM)
|
|
|
|
|
|
|
|